Tracking major market index and volatility forecasting are frequently employed in the industry. In fact, there are a lot of businesses that offer this as their main service. Here we have 1877 largest stocks in the U.S. equity market, and daily returns of each from January 2, 2004 through December 31, 2009 (1511 trading days). We will use several models to perform volatility forecasting and eventually conduct a visual comparison between these models in predicting excess returns.
Part I. Index Tracking
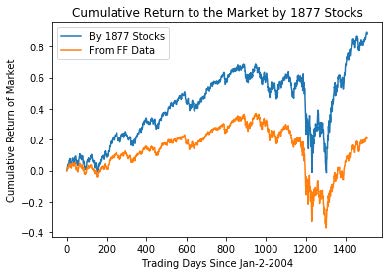
The sample cumulative return from 1877 stocks and the cumulative Fama-French return
are similar in shape and trend, but deviate from each other with a gap that increases over time. Given the 1877 stocks we have selected are the 1877 stocks with largest capitalization in the market, stocks with large market capitalization are the “causes” or leading forces of a market change. So these stocks return should be more volatile compared to that of the whole market.
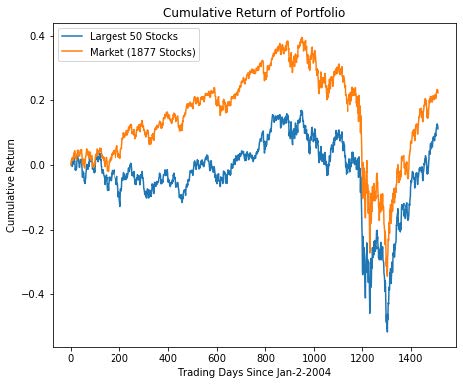
Using 50 stocks by largest capitalization on December 31, 2009 and a capitalization weighted portfolio, we were able to track the cumulative return to the market with 1877 stocks as shown above. We have been using stocks with the largest capitalization, and now we will select stocks randomly, and by changing the portfolio sizes, we can compare tracking errors.
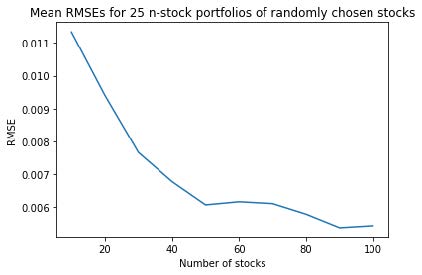
As shown above in the plot, the tracking errors (RMSE) decrease in general when we have more stocks in the portfolio.
To minimize the RMSE while also minimizing the number of stocks in our tracking portfolio would usually require solving a complex optimization problem. Here we can compare the RMSEs generated from different methods, i.e. randomly or by capitalization.
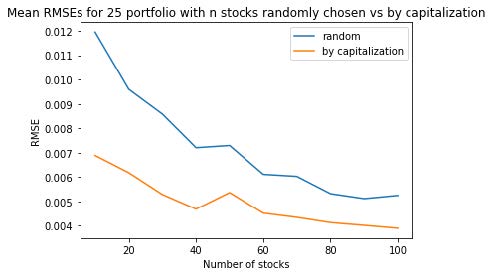
From the plot above the tracking errors (RMSE) from a portfolio with largest capitalization stocks are significantly smaller than a random portfolio. This implies our intuition that stocks with large capitalization are better representatives of the whole market seems valid.
Next, we will be using different methods to forecast volatility.
Part II. Volatility Forecasting Using Modern Portfolio Theory
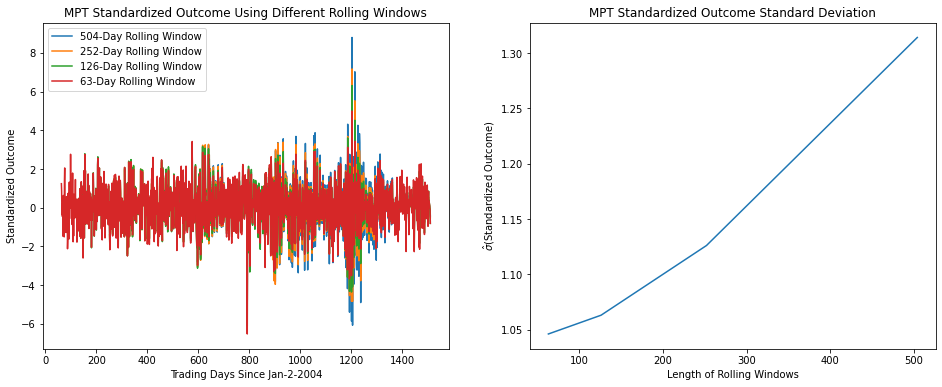
From comparing bias statistics across rolling windows, we observe that 63-day rolling window gives the best volatility forecast because it is sampling from less trading days, which makes it more sensitive to changes in volatility.
Part III. Volatility Forecasting Using Market Model

From comparing bias statistics across rolling windows, we again observe that 63-day rolling window gives the best volatility forecast because it is sampling from less trading days, which makes it more sensitive to changes in volatility. The biased statistics are very similar to the ones calculated under MPT model.
Part IV. Volatility Forecasting Using Fama-French Model
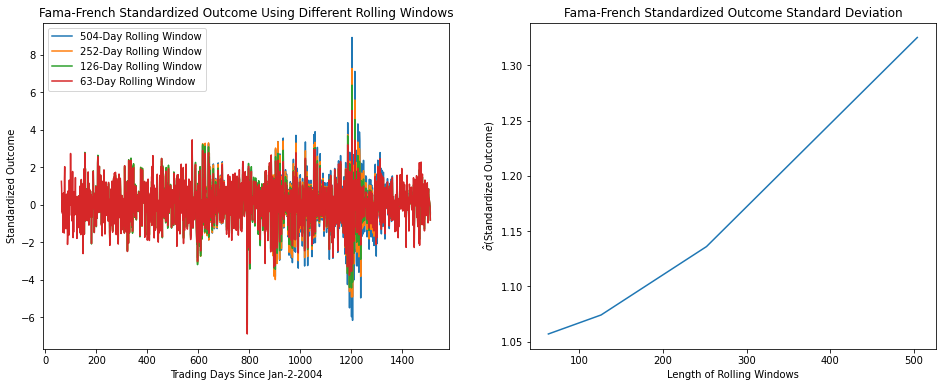
From comparing bias statistics across rolling windows, we observe that 63-day rolling
window gives the best volatility forecast because it is sampling from less trading days, which makes it more sensitive to changes in volatility. The biased statistics are very similar to the ones calculated under MPT and the market model.
We would prefer the approach by market model. Since the three approaches give very similar results, and the computations of predictions using the approach by the market model is the least (using only betas), it seems to be to the optimal choice to use in prediction.
Part V. Visual Test of the CAPM vs. the Fama-French Model
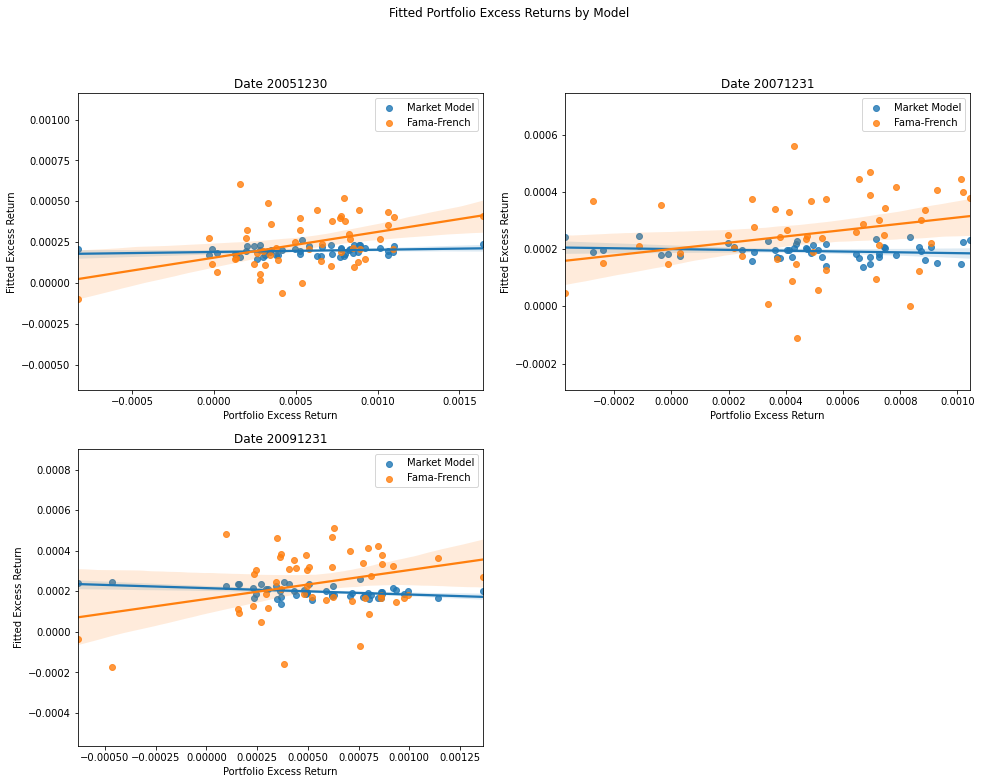
Based on the visual evidence, Fama-French Model seems to perform much better than
the Market Model. Market Model uses a 100 X 1 matrix that only has one dimension in explaining the variance, whereas Fama-French Model uses the larger 100 X 3 matrix, which has three vectors to capture the variance in excess returns. From the plots above, Fama-French Model is observed to have a more significant power in predicting excess returns from the upward-sloping regression line. It means there is a positive relationship between the actual portfolio excess returns and the fitted excess returns by Fama-French Model. However, this is not the case for the Market Model, since its line of best fit is approximately horizontal, indicating the fact that it does not have much power in explaining the variance in excess returns. The findings are somewhat consistent among the three dates with Fama-French Model in 2009/12/31 having the most prominent power in prediction. Lastly, there is randomness in the results, so there might be some loss of generality.
